|

|
|
Mechanical Pendulum Electronic
Control
By:
Bertrand Zauhar, VE2ZAZ
Last updated: 30/05/2015
On this
page, I describe my attempts and successes in
disciplining a mechanical pendulum to an
external 10MHz reference. Short term
accuracies in the order of 1 ppm can be
achieved.
The software source code on this page is
published under the GNU GPLv3 license. Please
refer to the following web site for
more detail on the licence agreement: http://www.gnu.org/licenses/gpl-3.0.html
I have been doing ham radio and electronics
for too many years. I have played and used
electronic crystals and oscillators during all
those years. In parallel, I have always been
fascinated with pendulum clocks. This must
have come from the fact that my parents owned
a 100-year old wall clock. The ticking and
chime sounds filled my childhood space.
A pendulum is one
form of oscillator, a mechanical counterpart
to the electronic oscillator. In that
sense, I wanted to experiment in making a
pendulum more accurate (disciplining) using
electronics, more or less what I had done in
the crystal oscillator world with my GPS-Derived
Frequency Standard.
So this page details the evolution of this
project. It also presents the final
implementation and offers the software to
those who would like to be inspired in doing
the same. As such, this is not offered as a
plug-and-play solution; but rather some
description to inspire others.
The first thing
I did was to read on the internet. I
strongly suggest you do so. This will
actually trigger some more interest. I
recommend you read Tom Van Baak's LeapSecond.com
website. In particular, the "Precision
Pendulum Clocks, Gravity and Tides"
section, which was an inspiration to
me.
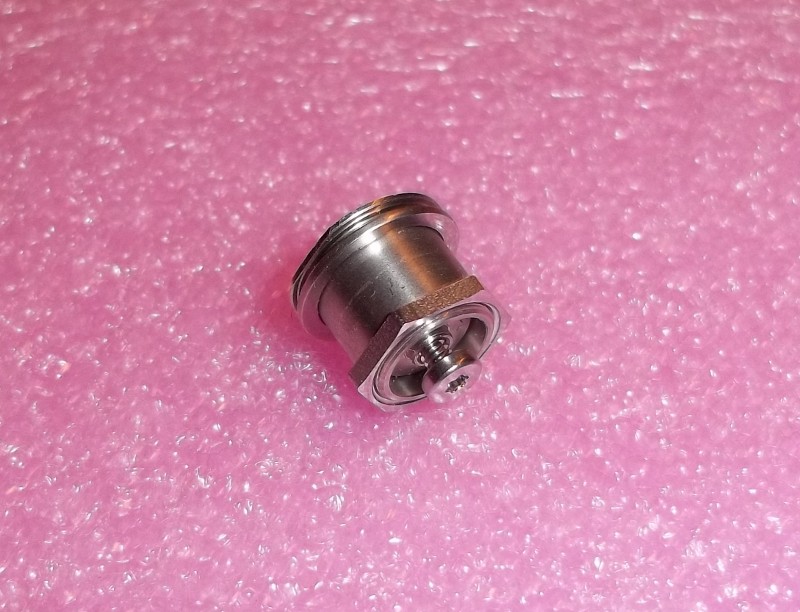
My first objective was to build a
simple mechanical pendulum, using what
I had on hand. I recovered a Hard Disk
Drive (HDD) seeking head ball bearing,
which is what I still use today.
Those are very well made and will
obviously last for a long time... I
also took a 1.2 meter long, 12 mm
square aluminium tubing. For the
weight, I used a clamp -on lead weight
normally sold to pull back the hand
shower hose of kitchen faucets.
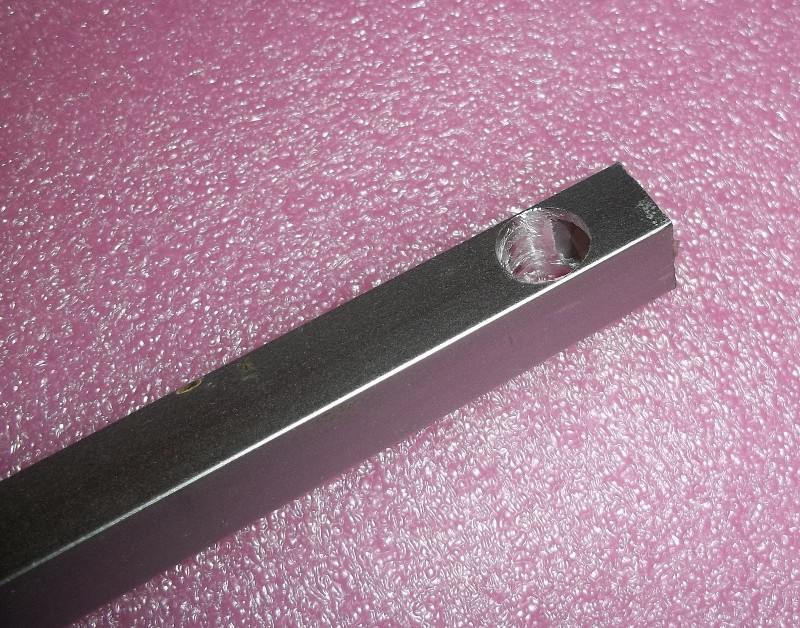
At the bottom end of the tubing, I
added a needle made of thin aluminium
flashing. This would trigger an
opto-detector. At the top end of the
tubing, I drilled a hole of the right
diameter to snug-fit the HDD bearing.
I also made a bracket to support the
pendulum via the bearing screws.
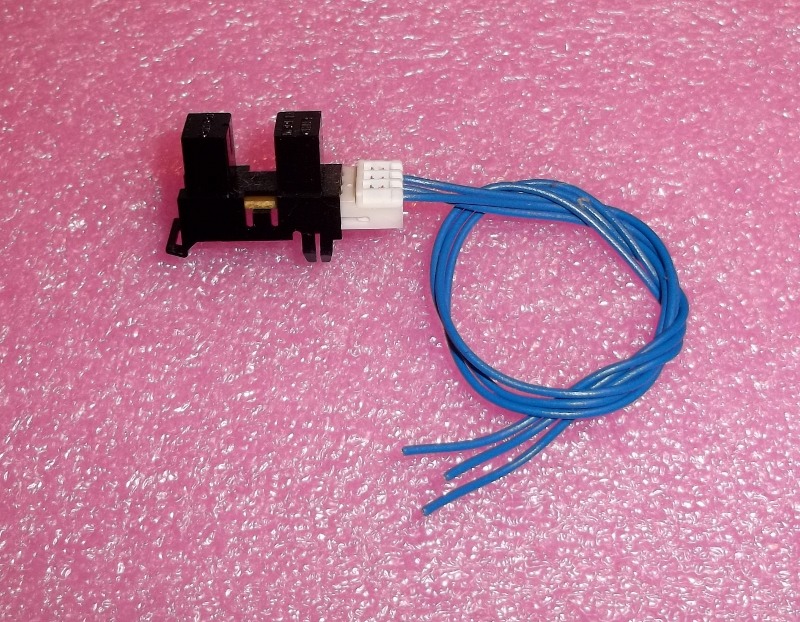
That opto-detector was recovered from
an old ink-jet printer. I applied a 5
mA DC bias on the LED and wired the
photo-transistor to a universal
frequency counter.
To support the pendulum, I used a
C-clamp to fix the attachement bracket
to the top of a 1.5 meter tall 19"
electronics rack. Obviously, the rack
had to be very stable so that little
energy would get dissipated by the
rack.
|
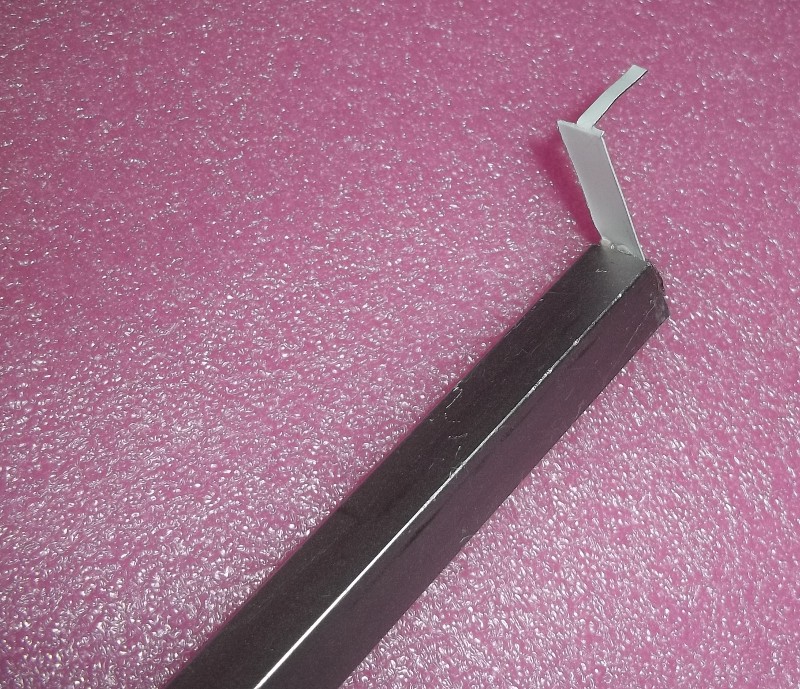
Aluminium Arm Needle
Arm Bearing Hole
HDD Bearing
Opto-Detector
|
This above setup allowed me to measure the
period of the pendulum, and adjust the height
of the weight to reach very close to a two
second period (actually a pulse every second,
but I skipped one pulse because the time it
takes to trigger the opto-detector on either
sides of the pendulum swing will not be the
same if the opto-detector is not positioned
exactly in the center of the pendulum swing).
The first finding was that this thing swung
smoothly. In fact, it swung so smoothly that
it was still oscillating a bit after 20
minutes, for a initial swing amplitude of
about 5 degrees of angle. That HDD bearing is
good! That setup looked promising.
The second finding, looking at the frequency
counter readings, was that the period varied
slightly as a function of the swing amplitude
(angle). This confirmed the theory, that there
are external factors that make the period go
longer with an increased oscillation
amplitude. This phenomenon confirmed my plan:
To design a system that adjusts the swing
amplitude to correct for time inaccuracies and
keep the pendulum locked to an external
reference.
The following experiment
was to periodically introduce some energy
into the system to compensate for the loss
of energy due to friction (air, bearing,
etc). For this I glued a small refrigerator
magnet to the end of the pendulum arm. I
also positioned a coil recovered from a DC
mechanical relay right below the magnet,
with the coil's magnetic field axis in the
same orientation as the pendulum arm. This
made the coil attract the magnet vertically
and downward when the pendulum was at rest.
With this kind of setup, one must energize
the coil only for a known
short duration,
otherwise the attracting force will slow
down the pendulum when passing beyond its
vertical point. this called for a pulsed
energy coil triggered by the opto-detector.
A 555 timer IC and pass transistor did the
trick. The 555 would energize the coil for
some adjustable duration when the
opto-detector has its light beam interrupted
by the needle.
First finding: That setup usually worked for
some time, for a few hours, but the pendulum
would often stop overnight. Clearly, there
were external factors that unbalanced the
system.
Second finding: Temperature had a
significant effect on period. So much that a
static setup like this one, with constant
impulse duration, would eventually die when
the pendulum is submitted to one or two
degrees Celsius of temperature variation.
This variation being typical of a heating
cycle on any central heating (furnace), a
dynamic pulse duration adjustment would be
required to maintain and regulate pendulum
oscillation.
Third finding: This behavior is mostly due
to the pendulum arm's thermal expansion.
Aluminum is one of the worst materials there
is in terms of thermal expansion. Clearly, a
better material should be used. See Wikipedia
for more detail on that topic.
I knew that, ultimately, I would be using a
micro-controller to "disciplin" the
pendulum. But I happened to have a Raspberry
Pi computer board on hand. I thus
decided to use it and quickly produce some
software to control the coil impulse
duration as a function of oscillation
period. I elected to use Python as the
programming language since I was quite
comfortable writing code in it. I had one
main concern, the real-time behavior of that
computer running a Linux operating system.
One asset I had used before is the RPIO
library of Python functions. It includes
some neat hardware interrupt management
routines.
The goal was to replace the 555 timer IC
with the Raspberry Pi's variable pulse
length. The operation consisted in:
1 -
Capturing the period via the opto-detector as
quickly as possible as soon as the pulse comes
in on one of the GPIO pins. Use the computer
clock to compute the period.
2 - Doing an averaging over 10
period readings to reduce the amount of
variability in the reading.
3 - Calculating a new coil pulse
width based on the average period:
Increase pulse width if
period is too short,
Decrease pulse width if
period is too long,
4- Sending the pulse as soon as
the needle comes out of the opto-detector
area.
The
operation ended up being quite functional and
useable. The following plot shows a
winter-time overnight indoors measurement.
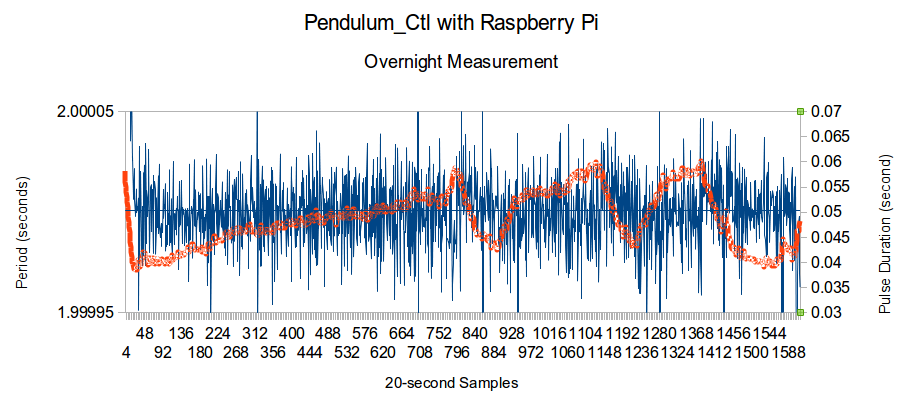
From this graph,
the following observations can be made:
- There is no measurement
of phase being done, merely a period
(1/F) measurement. Thus this is a
Frequency-Locked-Loop system (FLL),
not a Phase-Locked-Loop (PLL). We
should probably call it a
Period-Locked-Loop...
- There is a clear
compensation action for temperature
variations. The red curve shown the
variation of the coil pulse width due
to overnight temperature variations.
One can actually correlate the
behavior with the home heating system
cycles: At 22:00 (on the left) the set
temperature is brought down by a
couple of degrees C. This generates a
slow and long decline of the pulse
width to compensate for the shortening
of the pendulum arm. Starting half way
into the night, a couple of 1-degree C
heating cycles can be seen. In the
morning, a longer heating cycle occurs
to elevate the temperature back to 21
C. This overnight behavior was very
rewarding to see.
- Even with the raspberry
Pi's non-real-time operating system,
we can clearly see that measurement
and control of a pendulum is possible.
From that graph, we can say that a
short term accuracy of around +/- 25
PPM can be achieved. Not bad. But a
PIC micro-controller sampling a 10MHz
reference clock should do much better
in terms of accuracy and resolution.
Pendulum_Ctl.py

At this point, I
had enough information to implement a much
better system. Here are the specifications
I wanted to meet.
- The accuracy had to be
much better than the one achieved with
the aluminum arm and the Raspberry Pi,
with an reasonable objective of not
being worse than +/- 1ppm for a
10-sample period.
- The system would have to
be housed in a temperature-regulated
enclosure.
- The pendulum arm would
have to be made of a less temperature-expanding
material.
Pendulum
Arm Material
After consulting the
literature on thermal expansion
coefficient of various
materials, and since
CoVar and InVar are too pricey, I
decided to use wood: I happened to
have a strip of oak wood, with longitudinal
wood grain. It was a 1" (25 mm) square
piece from which I shaved off 50%
total on 2 sides, in an attempt to
reduce the arm weight and friction
in the air. The end-result is a 1"
by 1/2" (25mm x 12mm), 45" (1.15m)
long arm. |

|
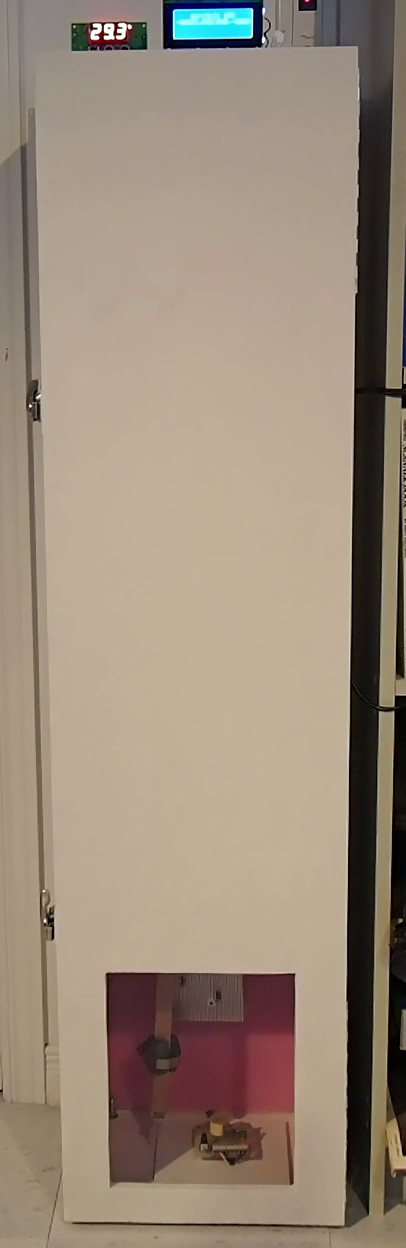
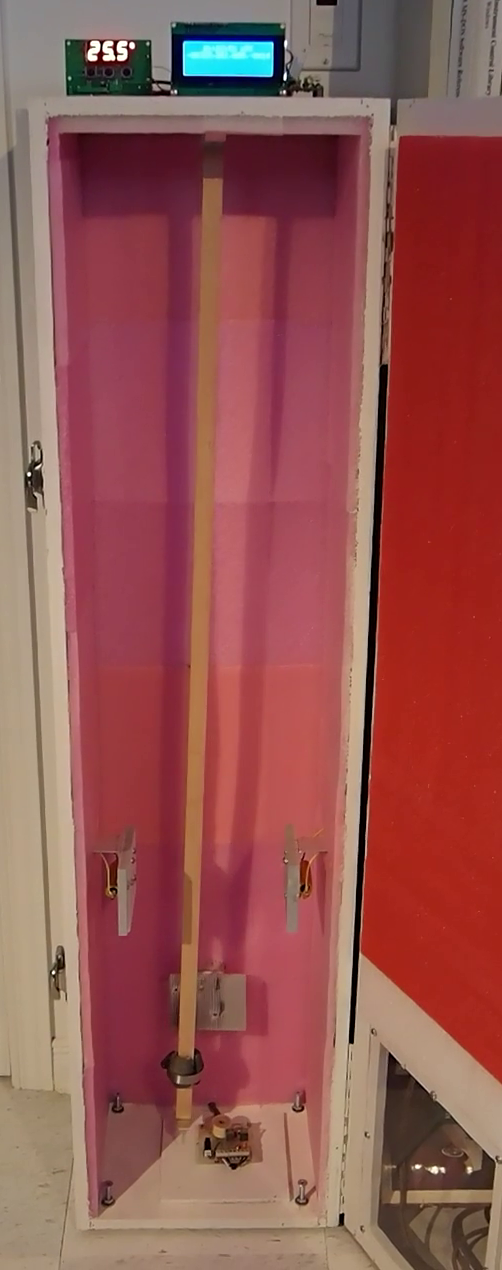
Enclosure
I built a 48" tall x 12" wide
x 9" deep (122cm x
30cm x 23cm), 1/2" (12mm) thick
plywood enclosure. I included, a
door, door latches, hinges and a
plexiglass window at the bottom of
the door. I insulated the interior
using some pink foam, the type
used in the shipping of
electronics. This is not the
typical cushion air foam, rather a
dense, air-tight, air-filled
matter. See one of the pictures
above for a close-up view of
the foam. The enclosure has
adjustable feet (pegs) to allow
for level and stability adjustment.
Environment control
The
enclosure is heated up to 30
degrees Celsius, which I consider
to be a higher temperature than
the ambient temperature will ever
reach. In order to heat up the
inside, I use three 100 Ohm, 50
Watts power resistors connected up
in series on the 120 VAC mains.
This represents a heating source
of around 45 Watts. The resistors
are mounted on three separate
aluminum heat sinks mounted
symetrically inside. The heating
are controlled by a temperature
controller (a fancy thermostat, I
guess) via a power Solid State
Relay. The mains is fused at 1
Ampere. This controller starts the
heating at 29.5 oC and stops it at
30.0 oC. I wish I could find a 0.1
oC controller for cheap. I guess I
will have to design it!
FLL control
I elected to port the FLL
firmware over to a PIC12F683
micro-controller. This is an
8-pin, sub-dollar, powerful
micro. The firmware does
essentially the same as on the
Python script described above.
It also sends a serial data
string containing the raw
information (measured period,
average period, current pulse
duration) so that further analysis
and plotting can be made on a
personal computer. The PIC firmware
Ansi-C source code is offered
here as inspiration for similar
setups.
Pendulum_Ctl.c

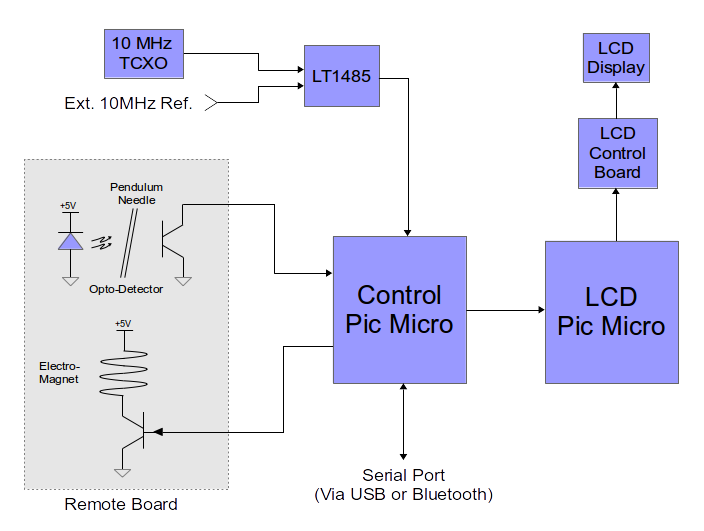
A stable timing
reference had to be
introduced in order to
increase period
measurement accuracy. I
use an on-board 10 MHz
Temperature-Compensated
Crystal Oscillator
(TCXO) as the reference
for incrementing the
internal PIC 16-bit
counter. I also provide
the ability to inject an
external 10MHz reference
signal through an
LTC1485, which
scales up the signal
to a 5V TTL swing.
For ease of interfacing with
the 4x20 HD44780-compatible
LCD module, I programmed a
separate PIC12F683
micro-controller to manage the
LCD display. It receives the
same data string from the FLL
Control PIC, formats the data
and sends the display commands
to a Digole
Universal Serial LCD Display
Adapter board. This board
eases LCD control using some
simple one-wire serial
commands instead of the more
complex HD44780 multiple
control line handshaking. Here
is the LCD PIC Micro source
code:
|
|
The electronics are mounted on
two custom-made printed circuit boards
(PCBs). The following simplified block
diagram shows the various functions
implemented.
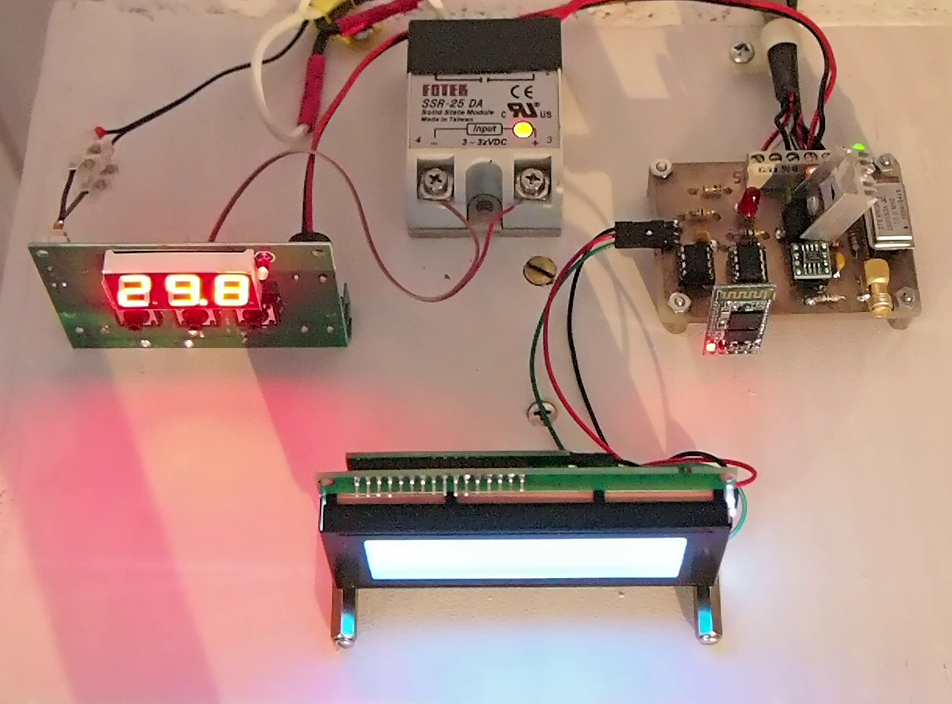
Here is a top view
of the FLL control hardware and the
temperature control hardware.
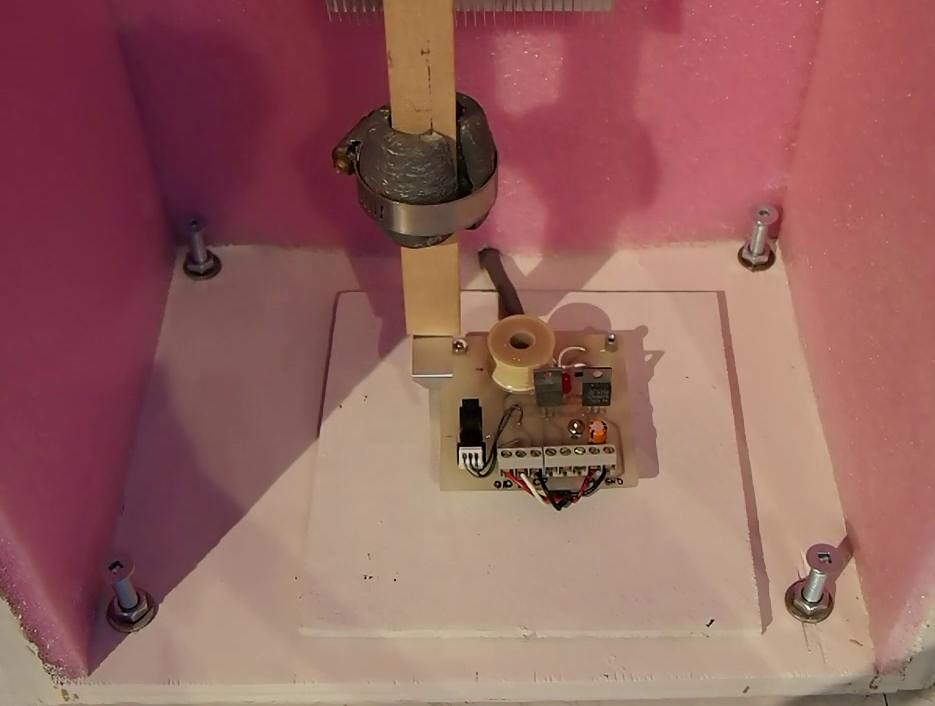
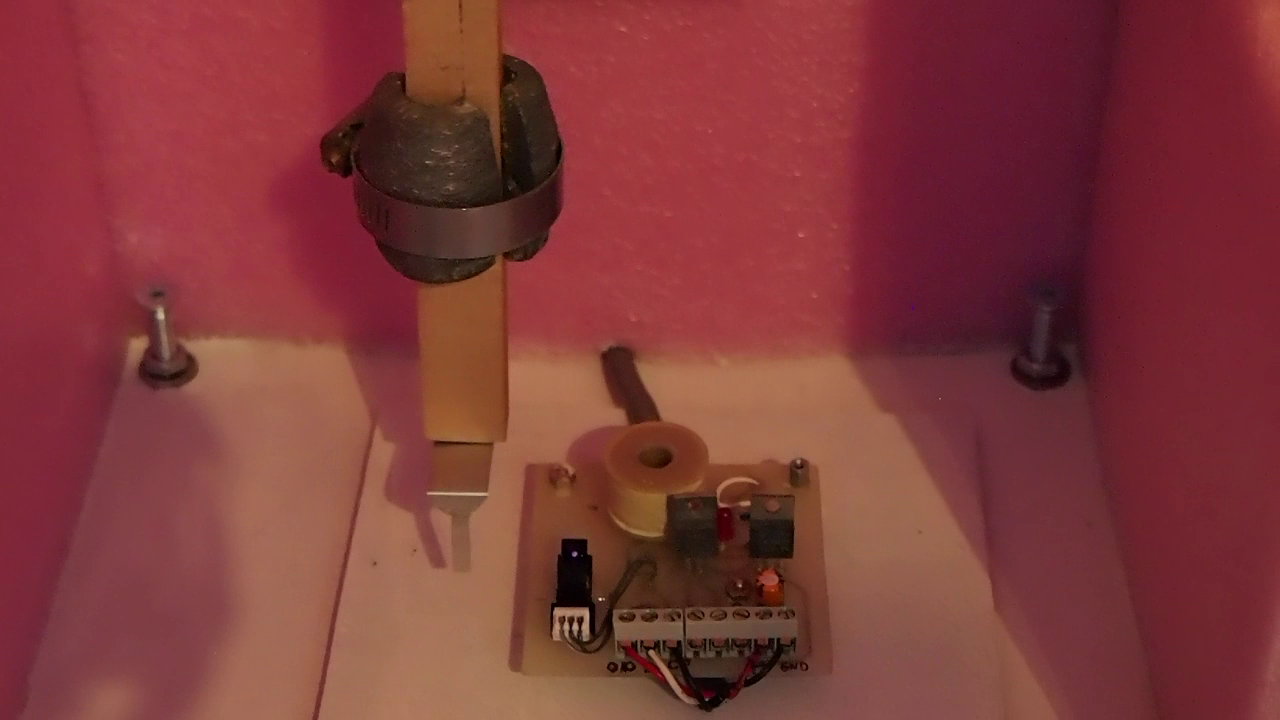
Here
is a top view of the remote control board
and lower end of the pendulum inside the
enclosure.
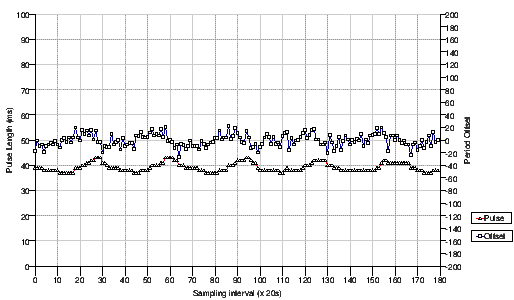
Results
Once the system is running stable at a
regulated temperature (~ 0.7 oC
variations), this is what you get:
- The
horizontal scale shows sampling
intervals of 20 seconds. Each point
is an average of ten
2-second pendulum periods. The graph
shows a one hour duration.
- The
top curve represents the period
offset from 2.0000000 seconds,
represented as 10.000 MHz counter
increments. In one 2-second pendulum
period, you would expect to counts
20,000,000 increments, and this
shows how many increments the offset
represents. In other words, 20
increments is a one part-per-million
offset.
- The
bottom curve represents the
electro-magnet pulse duration,
expresses in milliseconds. On this
graph, the pulse duration runs at
around 40 ms.
The
take-aways from this graph are:
- FLL
action is effective, as we can see
electro-magnet pulse length
adjustments to compensate for
temperature variations in the
enclosure. There is still a bit of
temperature variation ripple seen on
the top curve. I wish we could see a
perfectly flat top curve; this would
show perfect FLL action, but this is
not easily achievable. FLL
parameters can be tweaked but this
is a balancing act. You do not want
to over-compensate either or you
will lose "lock" and/or have a hard
time locking up again. Also, there
is lag due to averaging that it has
to deal with.
- The
top curve essentially stays within
the +/- 1 ppm band (+/- 20 counts),
which meets my initial objective for
ten-sample averaging. To put
everything in perspective, 1 ppm is
one microsecond out of one second.
Not bad for a mechanical pendulum!
Of course, on the long term, the
system will average out to much
better than that, as it will always
tend to center on the nominal 2
second period.
- Temperature
regulation to 0.5 oC is still
not great. I wish I had a 0.1 oC
regulation. I guess this will be
my next project... Challenging
if you consider the level and
stability of small signals to
measure.
- The PIC-micro counter-based
FLL approach is a much better
technique than the software-driven
Raspberry Pi clock. We got a +/- 25 ppm
on the Pi, and we get +/-
1 ppm with the PIC.
A
few more observations to make:
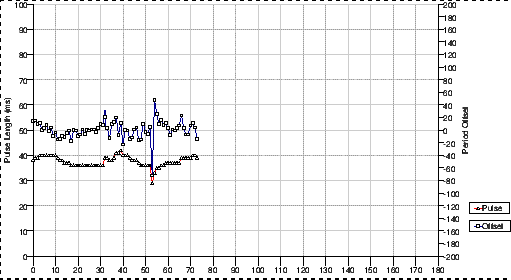
- Walking by
the enclosure, even
carefully slowly, is
noticeable if the enclosure
is not installed on a
concrete floor. In my
basement shack, where
development took place, I
have a raised floor made of
1/2" plywood. This is enough
to transfer vibration to the
pendulum. The graph to the
right illustrates this, with
the FLL bringing the
pendulum back where it
should be.
|
|
- My
original temperature controller used
a mechanical relay to turn on/off
the heating. This caused a lot of
noise on the period readings. I
simply disconnected the relay and
used its control voltage to operate
the solid state relay. Problem
solved.
I
produced a Youtube
video that shows many details and
provides additional information on
operation.
|
|
